https://www.greentechmedia.com/articles/read/massachusetts-mulls-smart-meter-pilots-5987#gs.3vSg7JE
In 2017 I decided to install rooftop solar panels and a NET meter. While the PV array can be monitored via a web portal to get hourly production data, Eversource (formerly NSTAR), only provides consumption readings once a month as part of their billing process.
Would it be possible for me to get data directly from my NET meter in the same way that the Tendril equipment did?
YES!
I found this old article on HackADay:which then linked to an active project using low cost hardware and open source software:
Unfortunately most of the hardware recommended in 2014 was no longer available; however, in reading through the extensive comments on bemasher's website led me to believe that as long as I had an rtl-sdr USB dongle that used the RTL2832U and R820T chipset, it would work.
[ a clarification from bemasher: Any rtl-sdr compatible radio will work, not just the R820T tuner. See http://osmocom.org/projects/sdr/wiki/rtl-sdr#Supported-Hardware ]
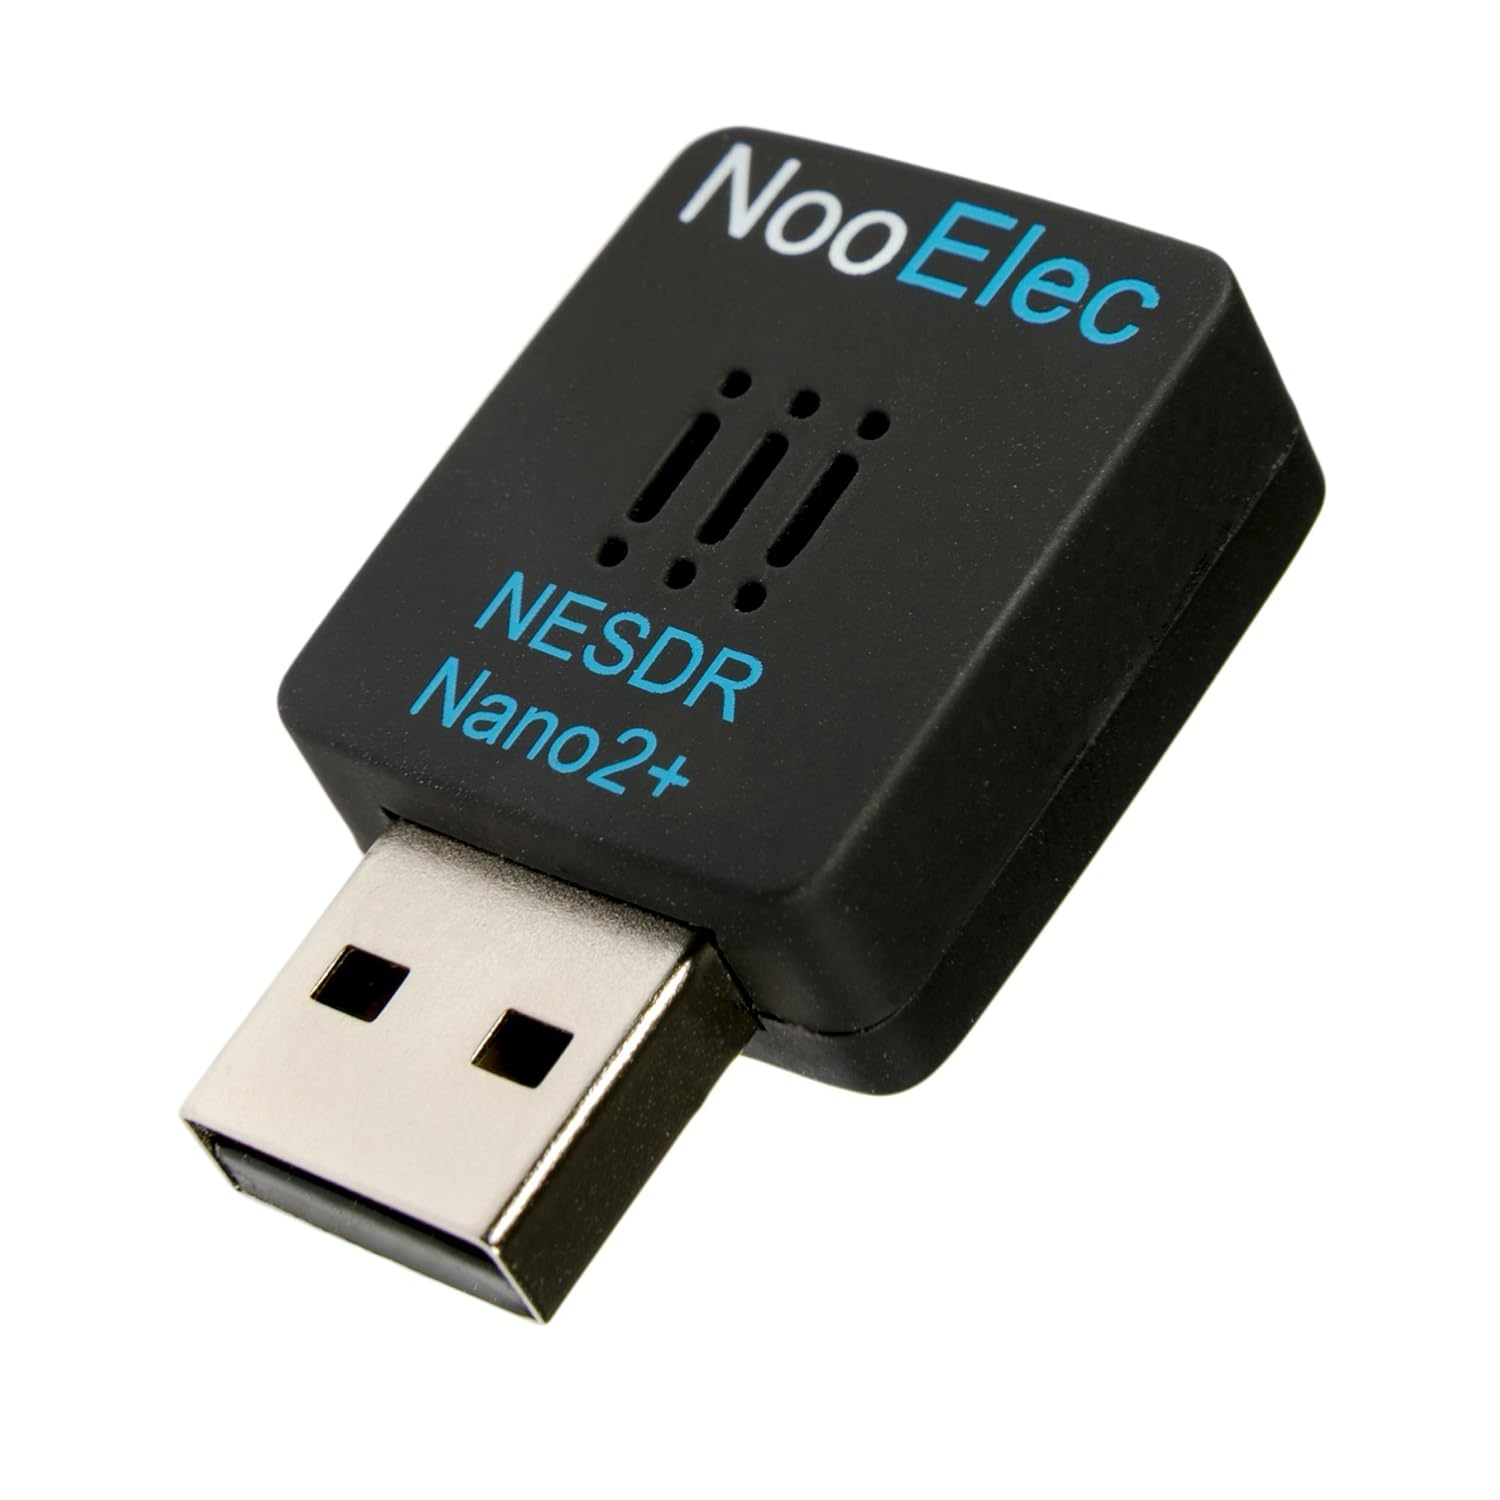
I ordered a $24 NooElec NESDR Nano 2+ from Amazon; my decision was based primarily on the smaller form factor, lower phase noise, 2 year warranty, and that it was spec'd for 24/7 operation:
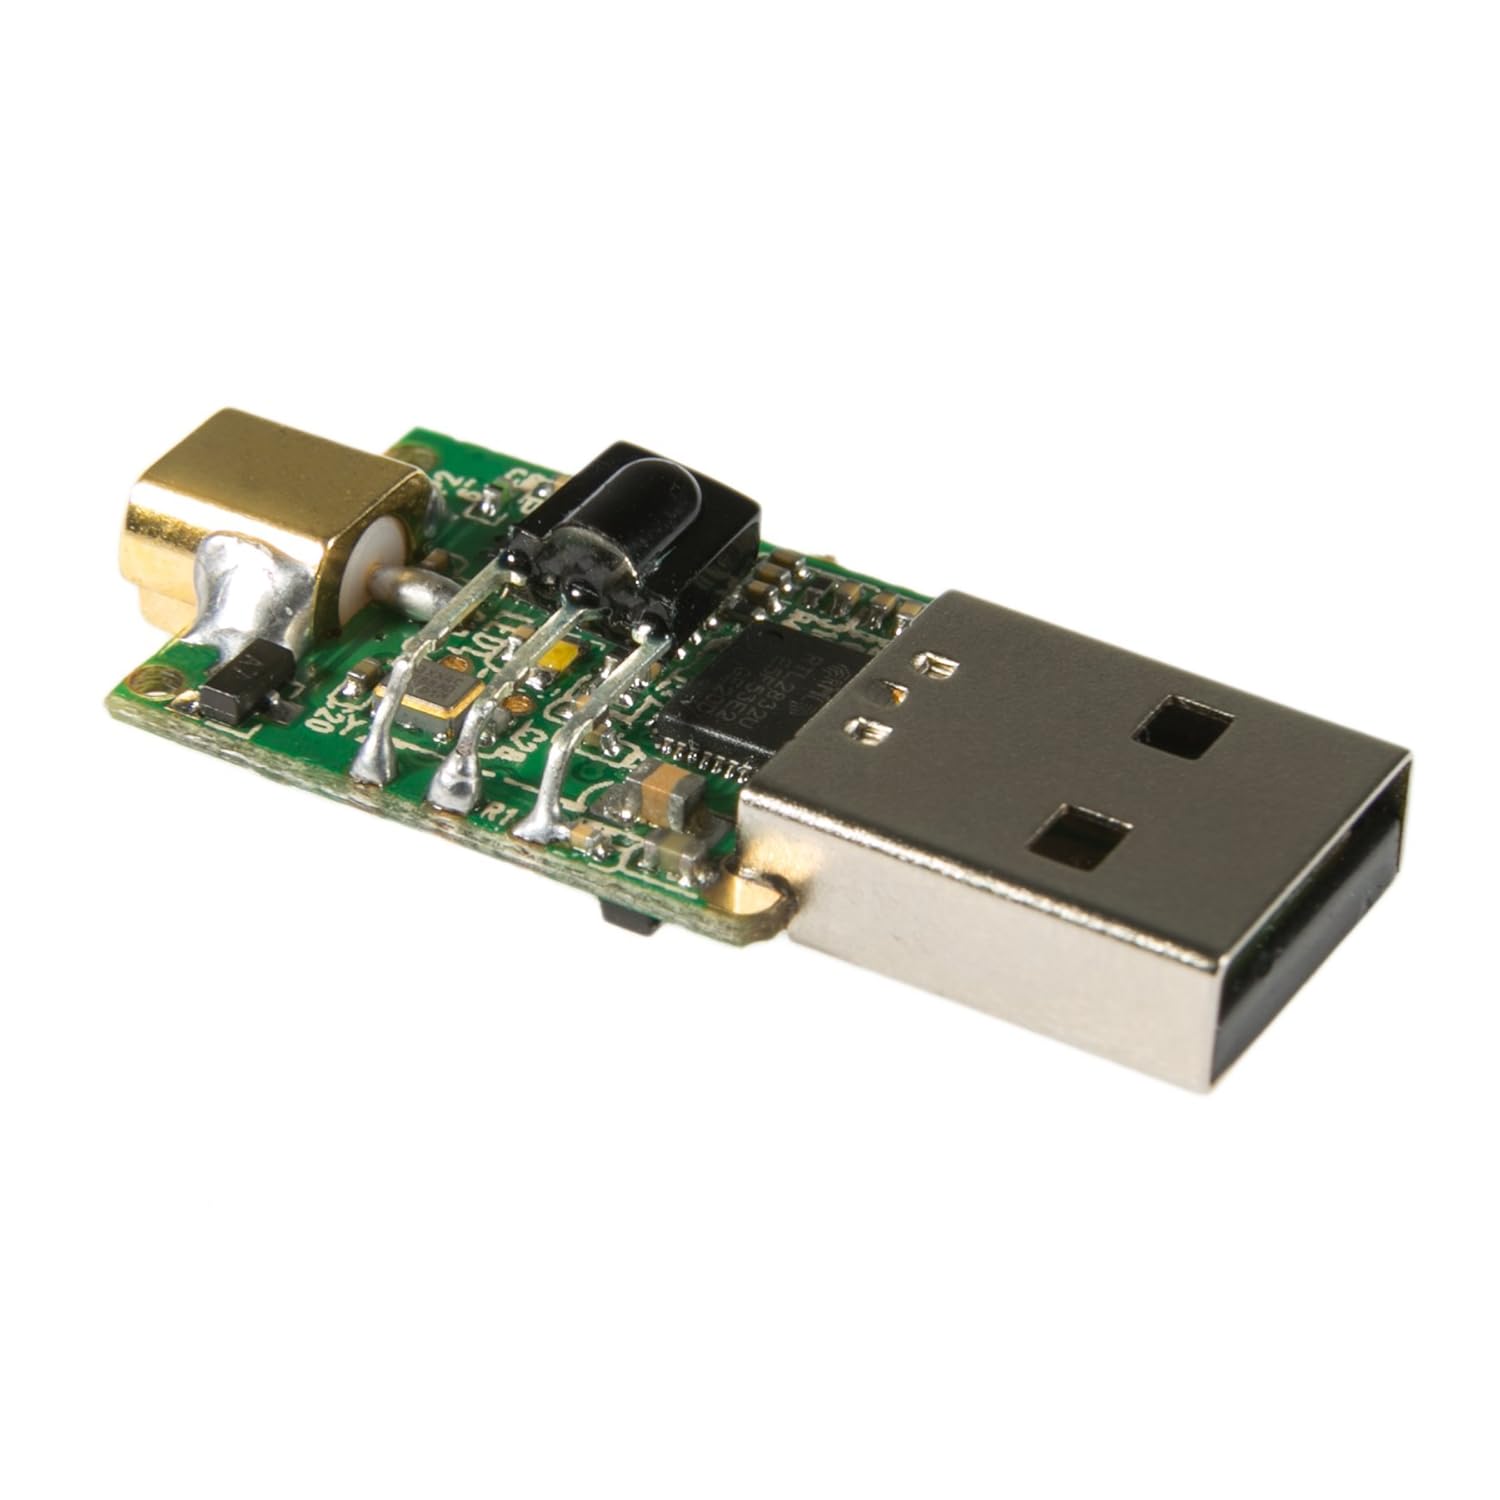
The hardware in the dongle was originally designed by RealTek for use as a digital TV tuner that could be connected to a computer, turning it into a Media Center PC. Hackers quickly discovered that the drivers could be modified to turn the device into a Software Defined Radio (SDR):
As an SDR, the device can be programmed to scan across a range of frequencies. Once a signal is acquired, it can be demodulated and decoded as shown below:
 |
| http://bemasher.net/rtlamr/signal.html |
- Download and install the SDR drivers for Windows from NooElec. When installing the driver, in the drop down box choose Bulk-In, Interface (Interface 0). This may also sometimes show up as something prefixed with “RTL28328U”. That choice is also valid.
- Download and install the pre-compiled Windows binaries for rtl_tcp (an I/Q spectrum server for RTL2832 based DVB-T receivers)
- Download and build bemasher's rtlamr (an RTL-SDR based Automatic Meter Reader (AMR) decoder:
go get github.com/bemasher/rtlamr- From a Windows Command Prompt terminal, start rtl_tcp
- From a separate Windows Command Prompt terminal, start rtlamr
When I first started rtlamr, I got a deluge of screen prints as I picked up every smart meter in the neighborhood. Fortunately, the tool supports various options to filter the data collection.
First I needed to limit my sample time:
-duration=0s: time to run for, 0 for infinite, ex. 1h5m10s
and then screen out repetitive messages (some meters were sending the same data every 5 seconds):
-unique=false: suppress duplicate messages from each meter
Next, I wanted to look for just my meter:
-filterid=: display only messages matching an id in a comma-separated list of ids.
However, I found that while I could detect and filter my neighbor's Itron C1SR meter using its eight digit Endpoint ID, I could not see my own Itron C4SR NET meter that has a 10 digit ID. It turns out that his older meter was using scm messaging, while mine uses scm+: -msgtype=scm: message type to receive: scm, scm+, idm, r900 and r900bcd
With the proper filters in place, I can now see that my meter is reading 99943.64 kWh:
[click image to enlarge; id's are masked in the screenshots]


Next steps:
- Move the hardware and software to the Raspberry Pi
- Set up a database to collect consumption data on an hourly basis
- Merge in the Solar Array generation data
- Present combined generation and consumption data on a single web portal